Until someone takes a shot, you don’t know…
The Background.
There’s a dovecot email server that:
- is constantly under attack
- is well shielded
- has never reported an issue
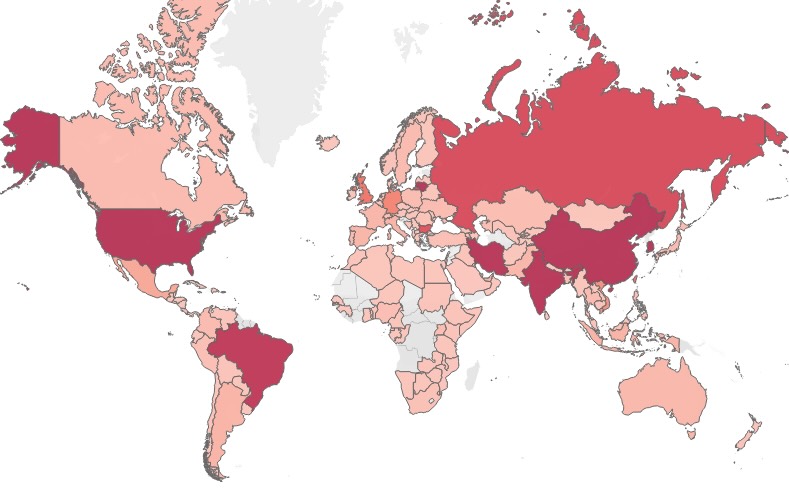
(mouse over to see number of attacks for the 320 day period from each country)
The Expectation.
Routine examination of 320 days of log files, revealed over 30,000 login attempts. This is “normal”. Historically the server had been targeted by computers from Lithuania and Iran, with mitigations already in place. Analysis was expected to cover attack patterns, whether usernames/ passwords were leaked, attack type (targeted or random).
The Results.
- the server was attacked with great stealth
- notification of attacks was non-existent
- logging for the server overall was poor
Flaws were revealed in the pre-analysis server configuration and assumptions.
How? What? Who? When?
For the email server, a log file line detailing a rejected login typically looks like below:
2023-11-25 10:12:21 auth: Info: passwd-file(delta@example.com,222.85.197.14): unknown user (given password: Delta2017)A little bash coding converts this to a csv to be read into spreadsheets and databases.
BASH Code
grep password: Downloads/dovecot.info | sed 's/ auth.*e(/,/' | sed 's/):/,/' | sed 's/<.*>,//' | sed 's/ (given password:/,/' | sed 's/)$//'2023-11-25 13:40:03, delta, 27.72.91.110, unknown user, Delta2015More coding magic and we created a list of computers and countries to act as a map. After the brief nerdy interlude:
- 30,483 denied login attempts
- 8,858 individual ip addresses
- 148 countries
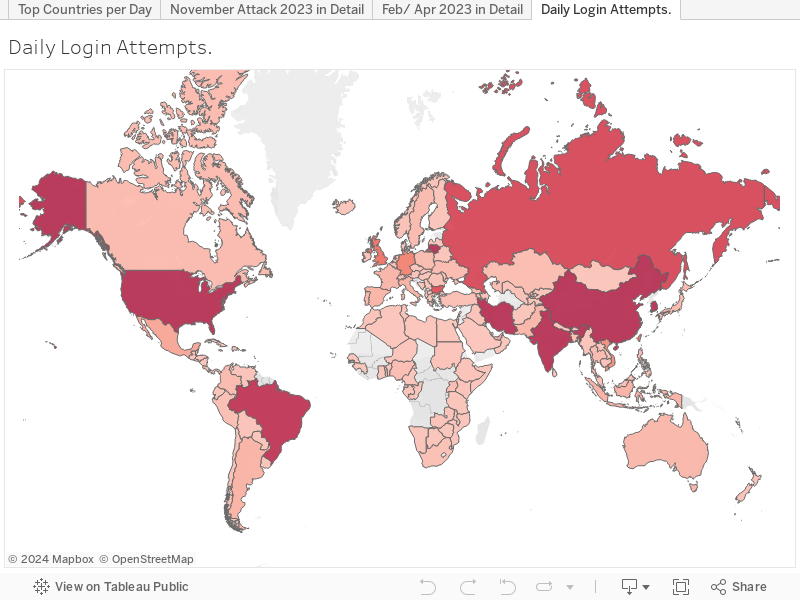
Pop the data into Tableau and output the pretty map above. The deeper the red, the more attacks came from that country.
The discovery:
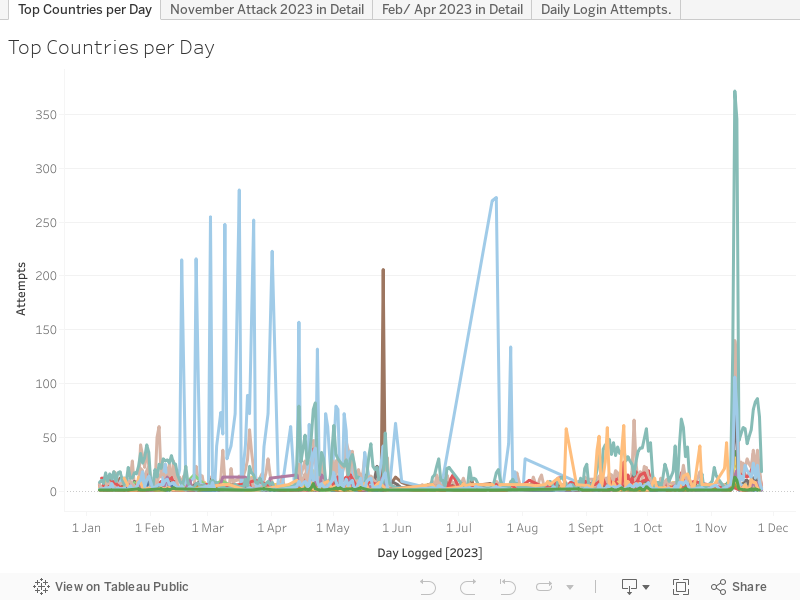
However plotting the number of login attempts per day. Oh my… the big spike in November 2023.

A quick SQL query found the top 10 days for number of attempts:
SQL Code
SELECT day_logged Date, count(ip) `Login Attempts` FROM all_country GROUP BY day_logged ORDER BY `Login Attempts` DESC LIMIT 10| Date | Login Attempts |
|---|---|
| 2023-11-12 | 1307 |
| 2023-11-13 | 1070 |
| 2023-11-11 | 468 |
| 2023-05-09 | 396 |
| 2023-04-14 | 390 |
| 2023-04-21 | 358 |
| 2023-04-22 | 356 |
| 2023-04-25 | 342 |
| 2023-07-19 | 329 |
| 2023-03-02 | 320 |
30,000 total attempts over a 320 day log file gives roughly 100 tries a day. On 12th and 13th November there were 2377 failed logins and no-one noticed.
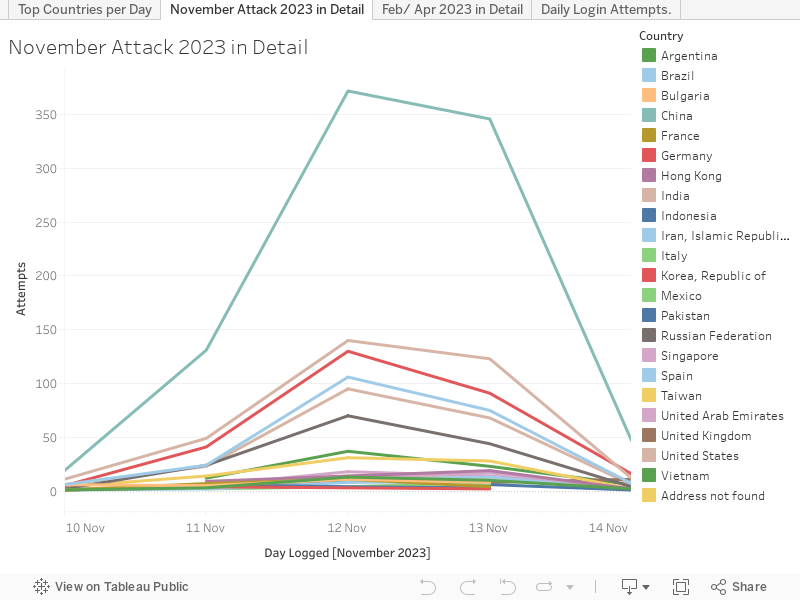
Feeding the data into Tableau and limiting the lines displayed to approximately the top 20 countries showed that most of the ip addresses originated in China (mouse over graphic below).
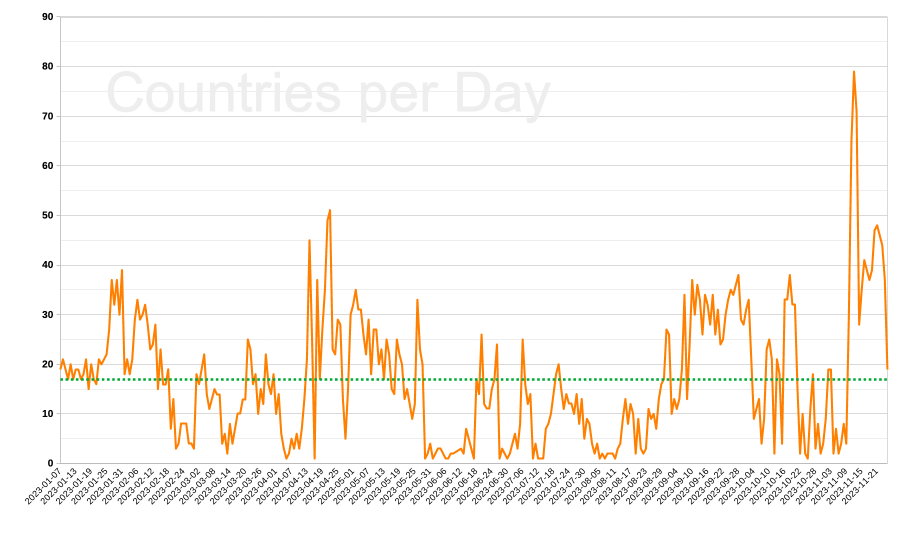
The November attack came from many more countries that the server normally sees in a day. the green dotted line indicating the mean number of countries per day, at around 18 visiting countries a day. The surge to almost 80 countries is indicative that not only were many more login attempts being made, but that the attacking botnet was co-ordinated internationally.
Limiting the graph from November 10th to 14th shows a distinctive pattern proportionally across the originating countries. (mouse over Tableau sheet below).
Invisible attackers:
Using SQL to analyse the original data on these dates we pull up the number of times each individual computer attacked which gives us a table.
SQL Code
SELECT
    day_logged AS date,
    country,
    ip `computer (ip address)`,
    COUNT(ip) attempts
FROM all_country
WHERE day_logged IN ("2023-11-10","2023-11-11","2023-11-12","2023-11-13","2023-11-14")
GROUP BY day_logged, country, ip
ORDER BY attempts desc, day_logged
LIMIT 20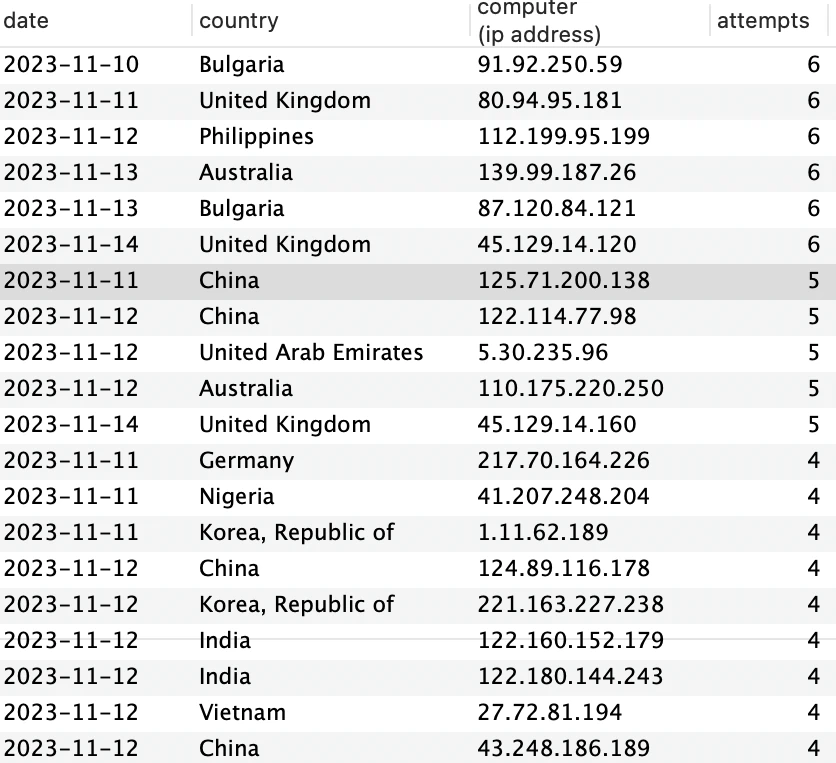
That was unexpected:
- Despite already finding that attacks on those dates originated mainly from China, there’s no big bad computer in China.
- The max number of attempts any computer made on these dates was 6.
- The Bulgarians seem a greater threat.
The Culprits:
What happened? Where did all the logins come from? Checking the data with another query, there are 915 login attempts from China over the duration. The spike that drew our attention was valid, China based IP addresses attempted login 3x more than India, however over the timescale another 100 countries were also observed.
| Country | No. of attempts |
|---|---|
| China | 915 |
| India | 335 |
| Korea, Republic of | 283 |
| Brazil | 218 |
| United States | 198 |
| Russian Federation | 144 |
| +94 other identifiable countries… |
SQL Code
SELECT day_logged, country, count(*) attempts
FROM all_country
WHERE country='China' AND day_logged in ('2023-11-10','2023-11-11','2023-11-12','2023-11-13','2023-11-14')
GROUP BY day_logged | Date | Total attempts/ day | Chinese originating ip |
|---|---|---|
| 2023-11-10 | 86 | 19 |
| 2023-11-11 | 468 | 131 |
| 2023-11-12 | 1307 | 372 |
| 2023-11-13 | 1070 | 346 |
| 2023-11-14 | 141 | 47 |
| total | 3072 | 915 |
Selecting all the computers for the timespan we find that most of them (64%) only attacked once.
Spreadsheet Methodology.
SQL builds attempts by ip address for relevant dates. Paste into spreadsheet (gives long list of ip addresses in Col A, attempts made by that ip in Col B).
SELECT ip, count(ip) Attempts FROM `all_country` WHERE `day_logged` IN ("2023-11-10","2023-11-11","2023-11-12","2023-11-13","2023-11-14") GROUP BY ip ORDER BY Attempts DESCUse Spreadsheet Filtering to get ‘no duplicates’ of Attempts column in column C.
In column D use following formula:
=COUNTIF($B$1:$B$1942,C1)Which takes a value “C1” and counts it in the attempts column.
| No of computers | Computer attacks N times | No of attacks | % of total computers |
|---|---|---|---|
| 1 | 8 | 8 | 0.05 |
| 4 | 7 | 28 | 0.21 |
| 27 | 6 | 162 | 1.39 |
| 16 | 5 | 80 | 0.82 |
| 51 | 4 | 204 | 2.63 |
| 139 | 3 | 417 | 7.16 |
| 469 | 2 | 938 | 24.15 |
| 1235 | 1 | 1235 | 63.59 |
| 1942 | << Totals >> | 3072 |
Not once per day – one password attempt and then go elsewhere. This behaviour slipped entirely under the firewall rules and mitigation. The server was configured to limit requests per minute per computer. It was also keeping a historical record of failed logins and then blocking when a threshold was passed. “One shot, not seen before” logins did meet any threshold, no alerts were triggered.
CONCLUSION. Instead of a big bad computer making hundreds of requests, the email server was stung by a swarm.
The Action.
The result of this incident was the creation of a notification program. Previously the server was configured to send out warnings if it CPU and disk usage exceeded a threshold. The attack being spread out over two and a half days did not place any load on the machine.
When an hourly threshold of failed logins is exceeded regardless of whether the logins came from one computer or many; a notification is sent out detailing the triggering factors, program and server locations, possible mitigation measures including geofencing. Individual computers in the swarm, have been logged and converted to a set of rules that can be slotted into a firewall either manually or automatically.
It is unknown as to why this botnet then disappeared, speculation without further investigation would not be profitable. Now we move onto the Iranians and a different strategy.